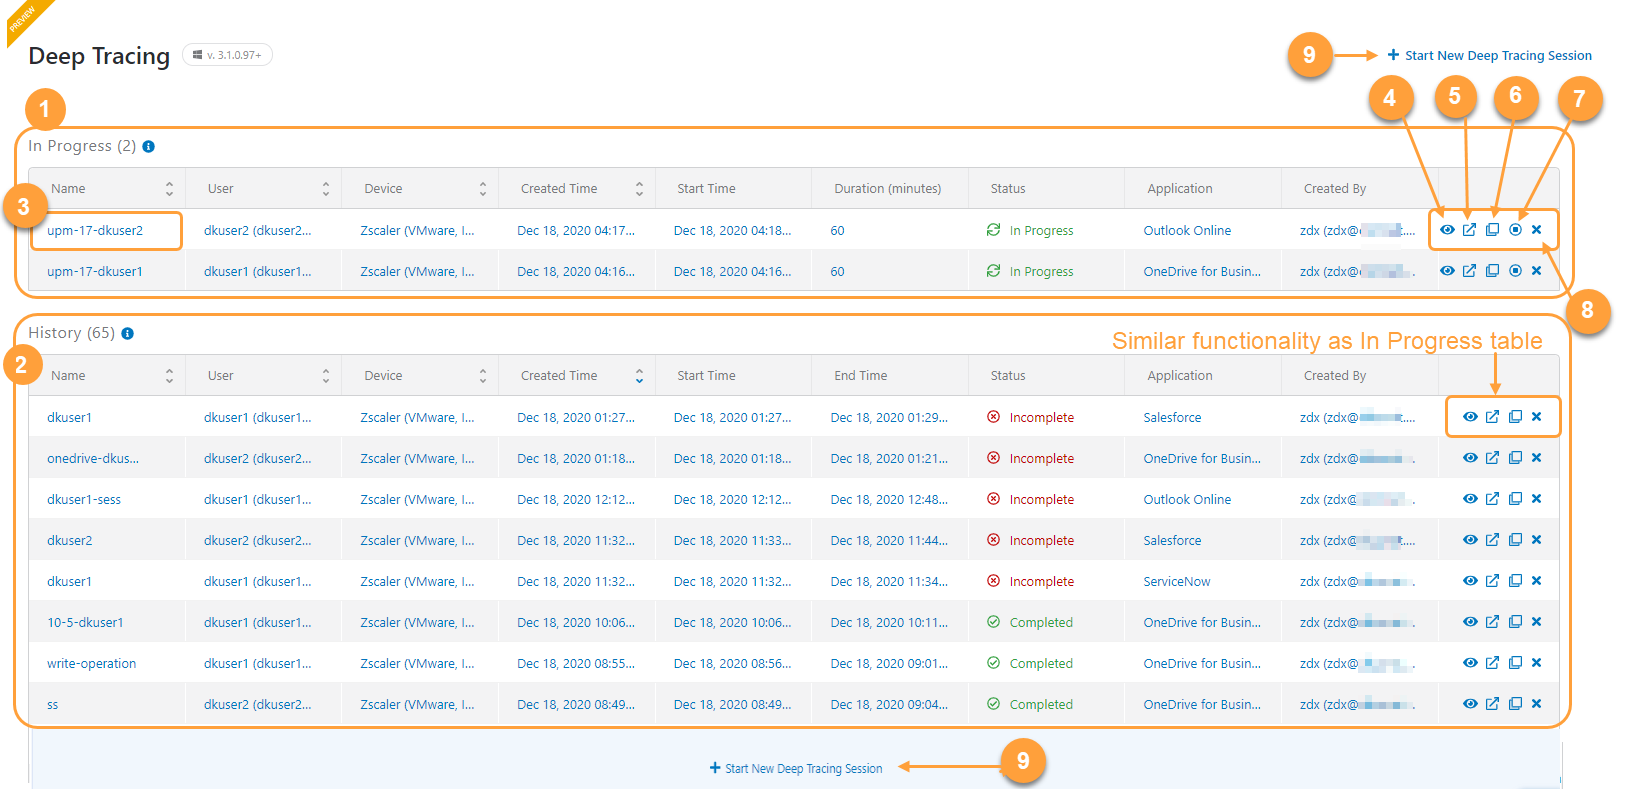
Deep Tracing in ZDX can provide deeper granularity into process-level information for a user. During a Deep Tracing session, information is collected every minute for the web probe, cloud path probe, as well as device statistics.
You can start a Deep Tracing session in the ZDX Admin Portal to analyze issues that users may be facing. You can select a user, a device, and an application that they are experiencing issues on to troubleshoot. You can choose to run the session from 5 minutes for up to 60 minutes to monitor issues.
You can view session information in the Deep Tracing page and also export it as a PDF copy for reference and information sharing. For information on data retention limits, see Ranges and Limitations.
Version Compatibility
To start a Deep Tracing session, the following version compatibility is required:
- For Windows devices, Zscaler Client Connector 3.1.0.97 (and later) and ZDX 2.0.0.14 (and later) are required.
- For macOS devices, Zscaler Client Connector 3.0.0.93 (and later) and ZDX 2.0.0.2 (and later) are required.
Viewing Deep Tracing Session Information
To view the Deep Tracing page in the ZDX Admin Portal, go to Administration > Deep Tracing.
Deep Tracing sessions for your organization are displayed in the In Progress and the History table. Sessions in both tables will display the following:
- Name: This is the name entered for the session during configuration. Clicking on the Name will open session results information in the same tab.
- User: The name and email address of the user are listed.
- Device: This is the device that is being analyzed for the session.
- Created Time: This is the time the session was created by the ZDX admin.
- Start Time: This indicates the time that the Zscaler Client Connector accepted the request and started collecting data.
- End Time: This is the time the session ended.
- Status: Session status will differ depending on which table the session is listed in.
Sessions in the In Progress table have the following status:
- Created: The session has been created by an admin in ZDX.
- Started: Zscaler Client Connector confirms that it has received a request to start a session and probe execution will begin. It might take a few minutes for the state to change from Created to Started.
- In Progress: Zscaler Client Connector is executing this session; this status indicates an ongoing session. These sessions will provide updated session data every minute.
Sessions in the History table have the following status:
- Abort Initiated: An admin canceled the session prematurely. The request will be forwarded to the Zscaler Client Connector.
- Aborted: After receiving the Abort Initiated request, Zscaler Client Connector acknowledges the request and the state is changed to Aborted. It might take a few minutes for the state to be updated.
- Expired: The request to start the session timed out due to lack of response from the Zscaler Client Connector. This could be because the device is offline or facing network issues.
- Failed: After restarting, Zscaler Client Connector was not able to run the previously scheduled probes due to some internal errors.
- Incomplete: The session was not completed due to issues in the pipeline. Partial data will be displayed in this case.
- Completed: The session has completed successfully.
- Application: The application being monitored for the session.
- Created By: The name and email address of the admin who created the session.
By default, the lists are sorted by the Start time, displaying the session with the latest Start Time on top. You can also sort the sessions by using the arrows next to the column names.
About the Deep Tracing Page
On the Deep Tracing page (Administration > Deep Tracing), you can do the following:
- View information on sessions in the In Progress table.
- View information on sessions in the History table.
- Click the Name of a session in the In Progress or the History table to display the session information in the same tab. You can then use the Export PDF button to export and save a PDF copy of the session information.
- Click the Eye icon in the row for a session in the In Progress or the History table to display the session information in the same tab. You can then use the Export PDF button to export and save a PDF copy of the session information.
- Open sessions in new tabs to compare details by using the Open in a New Tab icon.
- Copy a session by using the Copy icon to copy the details of a session. This will open a Start New Deep Tracing Session window with all details copied from the existing session. All fields are editable.
- Click the Stop button to stop a session in the In Progress table. This is not available for the sessions in the History table.
- Delete a session by using the Delete (X) icon. Deleting a sesssion will remove it from the Deep Tracing page.
- Start a new session by clicking the Start New Deep Tracing Session button. To learn more, see Starting a New Deep Tracing Session.